Research Article | | Peer-Reviewed

The Effects of the Angle of Incidence and Gallium Doping Level on the Performance of a CIGS Solar Cell Studied Under Dynamic Frequency Under Monochromatic Illumination

Received: 4 January 2026     Accepted: 19 January 2026     Published: 31 January 2026
Views:       Downloads:
Abstract

This article presents a model for studying a basic CIGS solar cell in dynamic frequency mode under monochromatic illumination. The study begins by solving the differential equation that highlights the expression of minority carrier density, followed by those of photocurrent density, photovoltage, short-circuit photocurrent density, and open-circuit photovoltage. This work finalizes the identification and study of the expressions for the shape factor, power, and conversion efficiency of the photovoltaic cell. The study of the dynamic impedance of the basic CIGS solar cell using Bode and Nyquist diagrams is also developed in this work. Thus, we observe that an increase in the angle of incidence tends to decrease the power of the photovoltaic cell, the form factor, and the conversion efficiency. On the other hand, increasing the gallium doping rate tends to improve the cell's performance. Furthermore, the results obtained from the impedance study show the existence of two specific pulsation zones. The first zone [0 rad⁄s; 3.16.107 rad⁄s] where the modulus is a constant; this is the static regime. The second zone ]3.16.107 rad⁄s; 108 rad⁄s [where the modulus increases; this is the dynamic regime. An increase in the angle of incidence with the dynamic impedance modulus is observed. Furthermore, the variation in the angle of incidence has no effect on the resonance frequency or phase. Furthermore, increasing the gallium doping level increases the dynamic resistance modulus. Subsequently, a slight decrease in the impedance phase is observed, synonymous with fluctuations in the pulse limiting the phase shift effects between the signal and the carriers produced. Finally, the Bode and Nyquist representations of the dynamic impedance show that inductive effects remain dominant.

Published in American Journal of Science, Engineering and Technology (Volume 11, Issue 1)
DOI 10.11648/j.ajset.20261101.11
Page(s) 1-9
Creative Commons

This is an Open Access article, distributed under the terms of the Creative Commons Attribution 4.0 International License (http://creativecommons.org/licenses/by/4.0/), which permits unrestricted use, distribution and reproduction in any medium or format, provided the original work is properly cited.

Copyright

Copyright © The Author(s), 2026. Published by Science Publishing Group

Keywords

CIGS, Frequency Modulation, Incidence Angle, Gallium Doping, Bode Diagram, Nyquist Diagram

1. Introduction
Cu(In,Ga)Se2 (CIGS) and related chalcopyrite compounds have attracted considerable interest for thin film photovoltaic device on account of their high optical absorption coefficient and adjustable band gap, which makes it possible to achieve high conversion efficiency in CIGS solar cells. The best CIGS thin film solar cell has reached a confirmed conversion efficiency of about 20% under a solar spectrum of AM 1.5 G . In addition, a simulation study on CIGS-based solar cells makes it possible to predict their performance. The CIGS-based solar cell model presented in this paper is therefore studied in dynamic frequency mode.
The solution of the differential equation used in this work highlighted the behavior of minority carriers and the density of minority carriers and the diffusion of capacity . The rest of the study led to the determination of the photocurrent density, the photovoltage, the short-circuit photocurrent density, and the open-circuit photovoltage.
This article continues the study of cell performance using Nyquist and Bode diagrams. To do this, the short-circuit photocurrent density is deduced from the photocurrent density m and the open-circuit photovoltage is deduced from the photovoltage. The ratio of the open-circuit photovoltage to the short-circuit photocurrent density will be the dynamic impedance of the photovoltaic cell and studied using Nyquist and Bode diagrams, highlighting the effects of the angle of incidence and the gallium doping rate .
After providing expressions for power, form factor, and efficiency, the article explains how the angle of incidence and gallium doping rate affect cell performance.
2. Theoretical Study
We consider a CIGS-based solar cells whose simplified structure is shown in Figure 1.
In this study, we will neglect the contribution of the emitter by focusing only on the bottom-up contribution. Under the effect of frequency-modulated monochromatic optical excitation, minority charge (electrons) carriers are generated in the absorbing layer of the solar cells. The continuity equation of the minority carriers in the x- axis base in frequency dynamic regime is of the form:
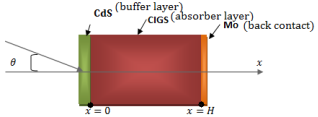
Figure 1. Simplified scheme of a one-dimensional CIGS-based solar cell.
Where 𝜃 is the angle of incidence, H is the thickness of the base.
D(ω).2δ(x,θ,t)x2-δ(x,θ,t)τ=-Gx,θ,t+δ(x,θ,t)t(1)
With D(ω) the complex diffusion coefficient of minority carriers; δx,θ,tthe density of minority carriers; Gx,θ,t the generation rate of minority carriers and τ the average life of minority carriers θ angle of incidence; t is time.
The density and generation rate of minority carriers can be set respectively in the form :
δx,θ,t=δ(x,θ)e(-iωt)(2)
Gx,θ,t=g(x,θ)e(-iωt)(3)
Where δ(x,θ) and g(x,θ) are the spatial component and e(-iωt) is the temporal component.
For illumination from the front face of the solar cell and depending on the angle of incidence, the spatial component of the generation rate is:
gx,θ= α(λ)Φ(λ)1-R(λ)cosθe-α(λ)x(4)
Where α(λ) is the absorption coefficient at the wavelength λ; R(λ) is the reflection coefficient of the material, Φ(λ) the incident photon flux, and θ the incidence angle.
By replacing equations (2), (3) and (4) in equation (1) we get:
2δ(x,θ)x2-δ(x,θ)Lω2+gx,θDω=0 (5)
with
Lω=L0(1-iωτ)1+(ωτ)2(6)
L0  intrinsic diffusion length
Lω the complex diffusion length
The general solution of the preceding equation (5) is given by the relation (7).
δx,θ=AcoshxLω+BsinhxLω-α(λ)Φ(λ)1-R(λ).Lω2.cosθDω.(α2(λ)Lω2-1)e-α(λ)x(7)
The constants A and B are determined from the following boundary conditions:
At junction x=0:
δx,θxx=0=SFDωδ0,θ(8)
on the rear face of the base (x=H):
δx,θxx=H= -SBDωδH,θ(9)
SF and SB denote the recombination speeds of the minority load carriers at the junction and rear face of the base respectively.
The expression of minority carriers density is expressed as a function of the CIGS absorption coefficient. This coefficient depends on gallium doping and is given by:
αλ,X=A(hcλ-Eg(X)) (10)
with A (cm-1 eV-1/2) a constant .
Eg(X) band gap of the CIGS base as a function of gallium doping level.
Note that: The ratio X=GaIn+Ga referred to in this article as the gallium doping level, determines the proportion of gallium atoms that replace indium atoms in the structure. The width of the CIGS band gap varies as a function of X between the values of pure CIS and pure CGS, according to the following empirical law : EgX=1,035+0,65X-0,264X(1-X).
Beyond the expressions of minority carriers density, photocurrent density and photovoltage are determined according to the angle of incidence of gallium doping rate, frequency and wavelength.
The photocurrent density is given by the following expression:
Jλ,ω,SF,SB,θ,X=q.Dω.δ(x,λ,ω,SF,SB,θ,X)xx=0(11)
where q is the elementary charge.
λ, wavelength, ω, angular frequency, SF, recombination rate at the junction, SB, recombination rate at the rear surface, θ, angle of incidence, X, gallium doping concentration.
The short-circuit photocurrent density is obtained from the expression of the photocurrent density (11) by tending the recombination velocity at the SF junction towards a very large limit.
Jλ,ω,SF,SB,θ,XSF>5.105Jccλ,ω,SB,θ,X(12)
From the excess minority carriers’ density, we can deduce the photovoltage across the junction, according to the Boltzmann’s relation as follow.
Vλ,ω,SF,SB,θ,X= VTln[Nbn02δ0,λ,ω,SF,SB,θ,X+1](13)
with VT the thermal voltage, Nb the base doping density, n0 the intrinsic carriers’ density.
λ, wavelength, ω, angular frequency, SF, recombination rate at the junction, SB, recombination rate at the rear surface, θ, angle of incidence, X, gallium doping concentration.
Thus, the open-circuit photovoltage will be deducted from the photovoltage by tending the recombination rate at the SF junction towards zero.
Vλ,ω,SF,SB,θ,XSF0 Vcoλ,ω,SB,θ,X(14)
The impedance of the photovoltaic cell that will be the subject of our study is given by the following expression.
Zλ,ω,SF,SB,θ,X=VCOλ,ω,SF,SB,θ,XJCCλ,ω,SF,SB,θ,X(15)
λ, wavelength, ω, angular frequency, SF, recombination rate at the junction, SB, recombination rate at the rear surface, θ, angle of incidence, X, gallium doping concentration.
This dynamic impedance of the photovoltaic cell will be studied using Nyquist and Bode diagrams. This will enable assessments to be made of the solar cell model.
Furthermore, the power supplied by the photovoltaic cell under monochromatic illumination of wavelength λi and for a given operating point at SF is expressed by the expression
P=I.Vph(16)
avec
I=Jph-Id(17)
where Id is the diode current, Jph photocurrent density
The FF form factor is the ratio between the maximum power supplied by the photovoltaic cell Pmax and the product of the short-circuit current JCC and the open-circuit voltage VCO (i.e., the maximum power of an ideal cell).
It is expressed by equation (18):
FF=Pmax(λ,ω,SB,SF,θ,X)VCOλ,ω,SB,SF,θ,X.JCC(λ,ω,SB,SF,θ,X)(18)
λ, wavelength, ω, angular frequency, SF, recombination rate at the junction, SB, recombination rate at the rear surface, θ, angle of incidence, X, gallium doping concentration
Efficiency is the ratio of the maximum power delivered by the cell to the incident light power. Efficiency is given by equation (19):
η=Pmax(λ,ω,SB,SF,θ,X)Pin(λ)=FFVCOJCCPin(λ)(19)
Where Pin(λ) is the incident power of light and is equal to solar power.
Subsequently, we will also study the effects of the angle of incidence and the gallium doping level on power, form factor, and efficiency.
3. Results and Discussions
3.1. Study of the Impedance Bode Diagram
The Bode diagram is a method developed to simplify the obtaining of frequency response plots.
In our work, it is a question of adapting the Bode concept to the plots of the amplitude of the impedance of the photopile and the phase of the impedance (in degrees) as a function of the logarithm of the pulsation.
3.1.1. Effect of the Angle of Incidence
Figure 2 shows the variation of the impedance modulus as a function of the logarithm of the pulsation, for different values of the incidence angle.
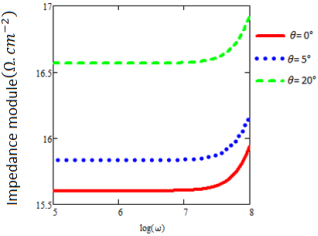
Figure 2. Impedance modulus as a function of the logarithm of the pulsation for different values of the incidence angle.
SF=3.103 cm/s;SB=3.103 cm/s;
λ=0.6μm;X=0,3
In this Figure 2, we distinguish two areas of dynamic impedance evolution:
1) the first zone corresponding to the pulsation interval 0rads;3,16 107rad/s: the impedance modulus remains constant; this is the quasi-static regime,
2) the second zone corresponding to the pulsation interval 3,16 107rad/s; 108 there is an increase in the impedance modulus with the logarithm of the pulsation; this is the dynamic regime.
In addition, Figure 2 shows that the dynamic impedance modulus increases with the incidence angle. But this variation in incidence angle does not affect the resonance pulse corresponding to the beginning of the variation of the impedance modulus with the pulse.
3.1.2. Effect of the Gallium Doping Rate on the Impedance Module
In Figure 3 we represent the impedance modulus as a function of the logarithm of the pulsation for different gallium doping rates.
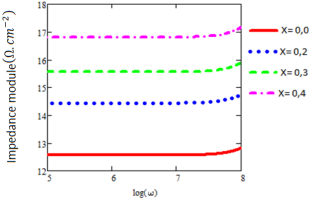
Figure 3. Impedance modulus as a function of the logarithm of pulsation for different gallium doping rates.
SF=3.103 cm/s;SB=3.103 cm/s;
λ=0.6μm;θ=0,0°
In this Figure 3 we observe two pulsation zones: the pulsation range0rads;3,16 107rad/s where the modulus is a constant; it is the quasi-static regime and that 3,16 107rad/s; 108 where the modulus increases; it is the dynamic regime. It should be noted that the increase in the gallium doping rate increases the dynamic resistance without affecting the pulsation limiting the two zones.
3.2. Study of the Bode Diagram of the Impedance Phase
This involves representing the impedance phase as a function of the logarithm of the pulse in Figures 4 and 5.
3.2.1. Effect of the Angle of Incidence on the Impedance Phase
Figure 4 shows the variation of the impedance phase as a function of the logarithm of the pulsation for different values of the incidence angle.
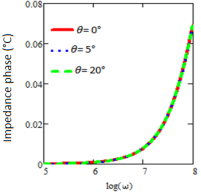
Figure 4. Impedance phase as a function of the logarithm of the pulsation for different values of the incidence angle.
SF=3.103 cm/s;SB=3.103 cm/s;
λ=0,6μm;X=0,3
Figure 4 illustrates the variation of the impedance phase as a function of the logarithm of the pulsation. Thus we distinguish in this graph two distinct domains. The first domain corresponds to pulsations lower than 106rad/s where the phase is almost equal to zero. In this field there is no phase shift between the signal and the product carriers. The second part corresponds to pulsations higher than 106rad/s, where we observe an increase in the phase with the pulsation. Thus there is a phase shift between the incident signal and the carriers produced. The observation of the Figure 4 indicates that the angle of incidence does not affect the phase, either the pulsation limiting the effects of the phase shift.
3.2.2. Effect of the Gallium Doping Rate on the Impedance Phase
Figure 5 shows the variation of the impedance phase as a function of the logarithm of the pulsation for different gallium doping rates.
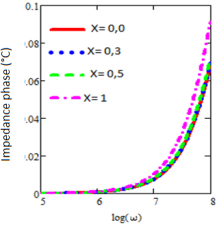
Figure 5. Impedance phase as a function of the logarithm of the pulsation for different gallium doping rates.
SF=3.103 cm/s;SB=3.103 cm/s;
λ=0,6μm;θ=0,0°
In this Figure 5 is presented the variation of the impedance phase as a function of the logarithm of the pulsation for different gallium doping rates. We also distinguish two areas. The first domain with pulsations lower than 106rad/s; the phase is almost null, there is no phase shift between the signal and the carriers produced. The second domain corresponds to pulsations higher than 106rad/s. Here we observe an increase in the phase with the increase in pulsation, there is a phase shift between the incident signal and the carriers produced. Figure 5 also shows that the increase in the gallium doping rate increases the impedance phase. But also we are witnessing a slight decrease in the pulsation limiting the effects of phase shift between the signal and the carriers produced.
3.3. Study of the Nyquist Diagram of Impedance
The Nyquist diagram is the representation of the imaginary part as a function of the real part of the complex impedance Z (𝜆,,SB,SF,SF,𝜃,X).
3.3.1. Effect of the Angle of Incidence
Figure 6 shows the Nyquist diagram of impedance with incidence angle effects.
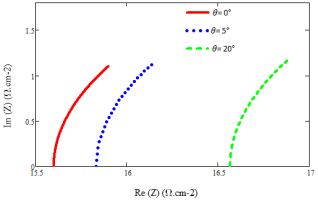
Figure 6. The imaginary part as a function of the real part of the impedance for different values of the incidence angle.
SF=3.103 cm/s;SB=3.103 cm/s;
λ=0,6μm;X=0,3
Figure 6 illustrates the variation of the Nyquist diagram with the effects of the incidence angle.
The Nyquist diagram of dynamic impedance shows us quadrants of circle. Thus the appearance of the curves shows the increase of the imaginary part with the increase of the real impedance bet according to the pulsation of the incident radiation.
In addition, Figure 6 shows that from the real part increases with the angle of incidence in the vicinity of zero pulsations, the maximum of the curves towards the high limit frequencies remains a constant regardless of the angle of incidence. Thus the radius of the quadrants of circle remains a constant.
3.3.2. Effect of the Gallium Doping Rate
Figure 7 shows the Nyquist diagram of impedance with the effects of gallium doping rate.
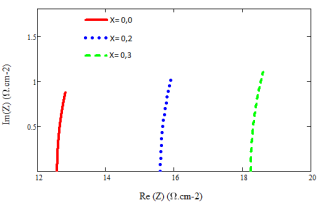
Figure 7. The imaginary part as a function of the real part of the impedance for different levels of gallium doping.
SF=3.103 cm/s;SB=3.103 cm/s;
λ=0,6μm;θ=0,0°
This Figure 7 shows the variation of the imaginary part as a function of the real part of the impedance for different levels of gallium doping. The Nyquist diagram of the dynamic impedance thus represented gives quadrants of circle. The appearance of the curves shows the increase of the imaginary part with the real impedance bet according to the pulsation of the incident radiation.
Subsequently all the curves show that the real part increases with the gallium doping rate in the vicinity of the zero pulsations. In addition, we observe that the maximum of the curves increases with the gallium doping rate towards the high limit frequencies. This shows the increase in the radii of these quadrants of circle. The effects of the gallium doping rate on this representation bodes well for a variation in shunt and series resistances with the gallium doping rate.
3.4. Study of the Power of the Photovoltaic Cell
3.4.1. Effect of the Angle of Incidence on Power
Figure 8 shows the variation in power as a function of photovoltage for different values of the angle of incidence.
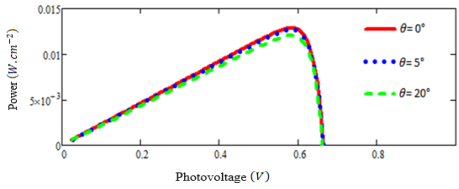
Figure 8. Module of the photovoltaic cell power as a function of the photovoltage for different values of the angle of incidence.
SF=3.103 cm/s;SB=3.103 cm/s;
ω= 3.103rad.s-1;λ=0,6μm;X=0,3
Figure 8 above shows that the electrical power module increases with photovoltage until it reaches its maximum value, which corresponds to the maximum operating point of the solar cell. From this value, the power gradually decreases and tends towards almost zero values when the photovoltage tends towards the open-circuit photovoltage value. In addition, the power module decreases as the angle of incidence increases, highlighting the effects of attenuation of radiation intensity. Thus, increasing the angle of incidence reduces the cell's efficiency in capturing incident energy.
3.4.2. Effect of the Gallium Doping Rate on the Power
Figure 9 shows the variation in power as a function of photovoltage for different gallium doping levels.
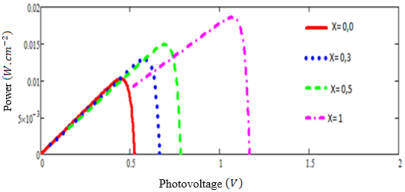
Figure 9. Variation of the power module as a function of the photovoltage for different values of the gallium doping rate.
SF=3.103 cm/s;SB=3.103 cm/s;ω= 3.103rad.s-1;λ=0,6μm;θ=0,0°
In Figure 9, we observe the same trends for the four curves. An increase in the power module with photovoltage reaching its maximum value and then gradually decreasing towards zero. Furthermore, increasing the gallium doping results in an increase in power..
3.5. Study of the Form Factor of the Photovoltaic Cell
3.5.1. Effect of the Angle of Incidence on the Form Factor
Figure 10 shows the variation in the form factor as a function of the angle of incidence.
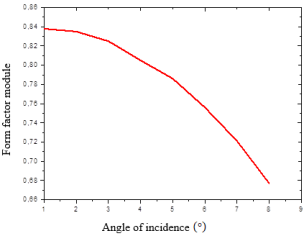
Figure 10. Form factor module as a function of the angle of incidence.
SF=3.103 cm/s;SB=3.103 cm/s;
ω=103rad/s;λ=0.6μm;X=0.3
Figure 10 shows the variation in the form factor modulus with the angle of incidence. We observe a decrease in the form factor as the angle of incidence increases. In fact, in the previous figure, we observed a decrease in the power modulus as the angle of incidence increased. These effects are reflected in the form factor.
3.5.2. Effect of the Gallium Doping Rate on the Form Factor
In Figure 11, we show the form factor module as a function of the gallium doping level.
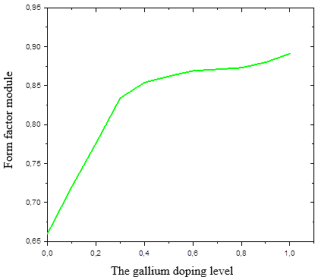
Figure 11. Variation in the modulus of the shape factor with the gallium doping level.
SF=3.103 cm/s;SB=3.103 cm/s;
ω=103rad/s;λ=0,6μm;θ=0,0°
Figure 11 illustrates the variation in the form factor with the doping level. We observe an increase in the form factor with an increase in the gallium doping level. Two phases can be distinguished: the first, with a doping level between 0 and 0.3, shows an almost linear increase in the form factor, indicating a gradual improvement in the conductivity of the material and the quality of the contacts. The second phase, with a doping level above 0.3, shows a slight deterioration in the conductivity of the material..
3.6. Study of Photovoltaic Cell Efficiency
3.6.1. Study of the Effect of the Angle of Incidence on Photovoltaic Conversion Efficiency
In Figure 12, we show the variation in efficiency as a function of the angle of incidence.
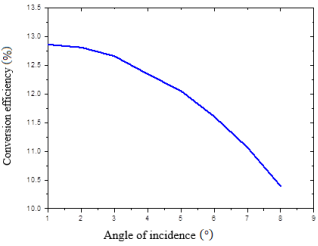
Figure 12. Photovoltaic conversion efficiency as a function of the angle of incidence.
SF=3.103 cm/s;SB=3.103 cm/s;ω=103rad/s;λ=0,6μm;X=0,3
Figure 12 illustrates the variation in solar cell efficiency as a function of the angle of incidence. We observe a decrease in efficiency as the angle of incidence increases. Similar to the decrease in power and form factor as the angle of incidence increases, we also see the same effects on efficiency. Indeed, a decrease in the angle of incidence is accompanied by a decrease in minority carriers and therefore a decrease in efficiency.
3.6.2. Effect of Gallium Doping Concentration on Photovoltaic Conversion Efficiency
Figure 13 shows the variation in the photovoltaic conversion efficiency of the cell with the gallium doping level.
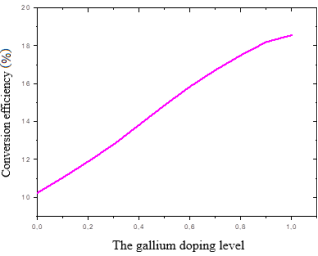
Figure 13. Variation in photovoltaic conversion efficiency with gallium doping level.
SF=3.103 cm/s;SB=3.103 cm/s;ω=103rad/s;λ=0,6μm;θ=0,0°
Figure 13 above illustrates the evolution of photovoltaic conversion efficiency with gallium doping levels. Cell efficiency increases with gallium doping levels. Gallium doping therefore enhances cell performance.
4. Conclusion
The dynamic impedance of the CIGS-based solar cell was studied using Bode and Nyquist diagrams. The study shows characteristic areas of pulsation highlighting the dynamic range. These diagrams also allowed us to deduce the dominance of inductive effects in the cell. In addition, the effects of the angle of incidence and the gallium doping rate were also discussed. Furthermore, the effects of the gallium doping rate and the angle of incidence studied on the power, form factor, and efficiency of the CIGS-based solar cell show that increasing the angle of incidence decreases the cell's performance by reducing the power, form factor, and therefore the efficiency of the cell. However, increasing the doping rate improves cell performance, with an optimal rate of 0.3 being most noticeable in terms of form factor. This rate of 0.3 is consistent with most experimental results published in the field of CIGS cells, which show that the best yields are obtained with a gap of approximately 1.2 eV , corresponding to a Ga rate close to 30%.
Conflicts of Interest
The authors declare no conflicts of interest.
Appendix

δ(x,θ,t)

density of minority carriers (cm-3)

Jph

Photocurrent density module (A. cm-2)

Jphcc:

short-circuit photocurrent density (A. cm-2)

ω

Angular frequency (rad. s-1)

λ

Wavelength (μm)

Vph

Photovoltage Module (V)

Vco

Open-circuit photovoltage (V)

SF

Recombination Speed at the junction (cm. s-1)

SB

Recombination Speed at the rear face (cm. s-1)

X

Gallium doping rate

P

Solar cell power (W. cm-2)

FF

Form Factor (%)

η

Cell Efficiency (%)

References
[1] I. Repins, M. A. Contreras, B. Egass, C. DeHart, J. Scharf, C. L. Perkins, B. To, R. Noufi, Prog. Photovoltaics 16 (2008) 235.
[2] Gerome Sambou, Alain Kassine Ehemba, Mouhamadou Mamour Soce, Amadou Diao, Moustapha Dieng «Frequency Modulation Study of a Monofacial Solar Cells Based on Copper Indium and Gallium Diselenide (CIGS) under Monochromatic Illumination: Influence of Incidence Angle and Gallium Doping» American Journal of Materials Science and Engineering, 2018, Vol. 6, No. 1, 7-11;
[3] Gérome Sambou, Amadou Diao, Jean Jude Domingo, Djimba Niane, Moustapha Dieng «Study of the Diffusion Capacity of a CIGS-based Solar Cell in Dynamic Frequency Regime Under Monochromatic Illumination: Effect of Incidence Angle and Gallium Doping Rate» American Journal of Energy Engineering 2018; 6(4): 50-56;
[4] N. Honma and C. Munakata, «Sample thickness dependence of minority carrier lifetimes measured using an ac photovoltaic method», Japan. J. Appl. Phys. 26,(1987) 2033-6.
[5] A. Dieng, I. Zerbo, M. Wade, A. S. Maiga et G. Sisoko, «Three-dimensional study of a polycrystalline silicon solar cell: the influence of the applied magnetic field on the elctrical parameters», Semicond. Sci. Technol. 26, (2011) pp: 5023-5032.
[6] J. N. Hollenhorst et G. Hasnain, «Frequency dependent whole diffusion in InGaAs double heterostructure» Appl. Phys. Lett, 65(15): (1995) 2203-2205.
[7] F. Ahmed et S. Garg, «simultaneous determination of diffusion length, lifetime and diffusion constant of minority carrier using a modulated beam» International Atomic Energy Agency. International centre for theorical physics. Internal report IC/86/129, 1987.
[8] J. Dugas, «3D modelling of a reverse cell made with improved multicrystalline silicon wafers». Solar Energy Materials and Solar Cells Volume 32. Issue 1, (January 1994). Pages 71-88.
[9] T. Flohr et R. Helbig, «Determination of minority-carrier lifetime and surface recombination velocity by Optical-Beam-Iduced-Current measurements at different light wavelengths» J. Appl. Phys. Vol. 66(7), (1989) pp 3060-3065.
[10] Sissoko, G., Museruka, C., Corréa, A., Gaye, I. and Ndiaye, A. L. (1996) Light Spectral Effect on Recombination Parameters of Silicon Solar Cell. World Renewable Energy Congress, Part III, 1487-1490.
[11] Morales-Acevedo «Effective absorption coefficient for graded band-gap semiconductors and the expected photocurrent density in solar cells».
[12] P. D. Paulson, R. W. Birkmire, and W. N. Shafarman. Optical characterization of Cu(In,Ga)Se2 alloy thin films by spectroscopic ellipsometry. Journal of Applied Physics, 94(2): 879, 2003.
[13] LATHI, BHAGWANDAS PANNALAL “Signals, systems and controls” Intext Educational Publisher, New York, 1973-1974.
[14] D. CHENVIDHYA, K. KIRTIKARA, C. JIVACATE. “Solar Energy Materials and Solar Cells” 80(2003) 459-464.
[15] R. ANIL KUMAR, M. S. SURESH AND J. NAGARAJU IEEE “Measurement of AC parameters of Gallium Arsenide (GaAs/Ge) solar cell by impedance spectroscopy”, IEEE Transactions on Electron Devices, Vol. 48, No. 9, pp 2177-2179, September 2001.
[16] Sunghun Jung, SeJin Ahn, Jae Ho Yun, Jihye Gwak, Donghwan Kim, and Kyun ghoon Yoon. Effects of Ga contents on properties of CIGS thin films and solar cells fabricated by co-evaporation technique. Current Applied Physics, 10(4): 990–996, July 2010.
Cite This Article
  • APA Style

    Sambou, G., Wade, I., Diedhiou, A., Diallo, K., Dieng, M. (2026). The Effects of the Angle of Incidence and Gallium Doping Level on the Performance of a CIGS Solar Cell Studied Under Dynamic Frequency Under Monochromatic Illumination. American Journal of Science, Engineering and Technology, 11(1), 1-9. https://doi.org/10.11648/j.ajset.20261101.11

    Copy | Download

    ACS Style

    Sambou, G.; Wade, I.; Diedhiou, A.; Diallo, K.; Dieng, M. The Effects of the Angle of Incidence and Gallium Doping Level on the Performance of a CIGS Solar Cell Studied Under Dynamic Frequency Under Monochromatic Illumination. Am. J. Sci. Eng. Technol. 2026, 11(1), 1-9. doi: 10.11648/j.ajset.20261101.11

    Copy | Download

    AMA Style

    Sambou G, Wade I, Diedhiou A, Diallo K, Dieng M. The Effects of the Angle of Incidence and Gallium Doping Level on the Performance of a CIGS Solar Cell Studied Under Dynamic Frequency Under Monochromatic Illumination. Am J Sci Eng Technol. 2026;11(1):1-9. doi: 10.11648/j.ajset.20261101.11

    Copy | Download

  • @article{10.11648/j.ajset.20261101.11,
      author = {Gerome Sambou and Ibrahima Wade and Aliou Diedhiou and Khamissa Diallo and Moustapha Dieng},
      title = {The Effects of the Angle of Incidence and Gallium Doping Level on the Performance of a CIGS Solar Cell Studied Under Dynamic Frequency Under Monochromatic Illumination},
      journal = {American Journal of Science, Engineering and Technology},
      volume = {11},
      number = {1},
      pages = {1-9},
      doi = {10.11648/j.ajset.20261101.11},
      url = {https://doi.org/10.11648/j.ajset.20261101.11},
      eprint = {https://article.sciencepublishinggroup.com/pdf/10.11648.j.ajset.20261101.11},
      abstract = {This article presents a model for studying a basic CIGS solar cell in dynamic frequency mode under monochromatic illumination. The study begins by solving the differential equation that highlights the expression of minority carrier density, followed by those of photocurrent density, photovoltage, short-circuit photocurrent density, and open-circuit photovoltage. This work finalizes the identification and study of the expressions for the shape factor, power, and conversion efficiency of the photovoltaic cell. The study of the dynamic impedance of the basic CIGS solar cell using Bode and Nyquist diagrams is also developed in this work. Thus, we observe that an increase in the angle of incidence tends to decrease the power of the photovoltaic cell, the form factor, and the conversion efficiency. On the other hand, increasing the gallium doping rate tends to improve the cell's performance. Furthermore, the results obtained from the impedance study show the existence of two specific pulsation zones. The first zone [0 rad⁄s; 3.16.107 rad⁄s] where the modulus is a constant; this is the static regime. The second zone ]3.16.107 rad⁄s; 108 rad⁄s [where the modulus increases; this is the dynamic regime. An increase in the angle of incidence with the dynamic impedance modulus is observed. Furthermore, the variation in the angle of incidence has no effect on the resonance frequency or phase. Furthermore, increasing the gallium doping level increases the dynamic resistance modulus. Subsequently, a slight decrease in the impedance phase is observed, synonymous with fluctuations in the pulse limiting the phase shift effects between the signal and the carriers produced. Finally, the Bode and Nyquist representations of the dynamic impedance show that inductive effects remain dominant.},
     year = {2026}
    }
    

    Copy | Download

  • TY  - JOUR
    T1  - The Effects of the Angle of Incidence and Gallium Doping Level on the Performance of a CIGS Solar Cell Studied Under Dynamic Frequency Under Monochromatic Illumination
    AU  - Gerome Sambou
    AU  - Ibrahima Wade
    AU  - Aliou Diedhiou
    AU  - Khamissa Diallo
    AU  - Moustapha Dieng
    Y1  - 2026/01/31
    PY  - 2026
    N1  - https://doi.org/10.11648/j.ajset.20261101.11
    DO  - 10.11648/j.ajset.20261101.11
    T2  - American Journal of Science, Engineering and Technology
    JF  - American Journal of Science, Engineering and Technology
    JO  - American Journal of Science, Engineering and Technology
    SP  - 1
    EP  - 9
    PB  - Science Publishing Group
    SN  - 2578-8353
    UR  - https://doi.org/10.11648/j.ajset.20261101.11
    AB  - This article presents a model for studying a basic CIGS solar cell in dynamic frequency mode under monochromatic illumination. The study begins by solving the differential equation that highlights the expression of minority carrier density, followed by those of photocurrent density, photovoltage, short-circuit photocurrent density, and open-circuit photovoltage. This work finalizes the identification and study of the expressions for the shape factor, power, and conversion efficiency of the photovoltaic cell. The study of the dynamic impedance of the basic CIGS solar cell using Bode and Nyquist diagrams is also developed in this work. Thus, we observe that an increase in the angle of incidence tends to decrease the power of the photovoltaic cell, the form factor, and the conversion efficiency. On the other hand, increasing the gallium doping rate tends to improve the cell's performance. Furthermore, the results obtained from the impedance study show the existence of two specific pulsation zones. The first zone [0 rad⁄s; 3.16.107 rad⁄s] where the modulus is a constant; this is the static regime. The second zone ]3.16.107 rad⁄s; 108 rad⁄s [where the modulus increases; this is the dynamic regime. An increase in the angle of incidence with the dynamic impedance modulus is observed. Furthermore, the variation in the angle of incidence has no effect on the resonance frequency or phase. Furthermore, increasing the gallium doping level increases the dynamic resistance modulus. Subsequently, a slight decrease in the impedance phase is observed, synonymous with fluctuations in the pulse limiting the phase shift effects between the signal and the carriers produced. Finally, the Bode and Nyquist representations of the dynamic impedance show that inductive effects remain dominant.
    VL  - 11
    IS  - 1
    ER  - 

    Copy | Download

Author Information
  • Abstract
  • Keywords
  • Document Sections

    1. 1. Introduction
    2. 2. Theoretical Study
    3. 3. Results and Discussions
    4. 4. Conclusion
    Show Full Outline
  • Conflicts of Interest
  • Appendix
  • References
  • Cite This Article
  • Author Information